Self-Benchmarking in Maintenance of a Chemical Plant
Claus Borgböhmer
Sasol Solvents Germany GmbH
Markus Ahorner
algorithmica technologies GmbH
Dr. Patrick Bangert
algorithmica technologies GmbH
Abstract
We propose that popular benchmarking studies can be augmented or even replaced by a method we call self-benchmarking. This compares the present state of an industrial plant to a state in the past of the same plant. In this way, the two states are known to be comparable and it is possible to interpret any changes that have taken place. The approach is based on data-mining and thus can be run regularly in an automated fashion. This makes it much faster, cheaper and more meaningful than regular benchmarking. We demonstrate by the example of maintenance in the chemical industry that this approach can yield very useful and practical results for the plant.
Traditional Benchmarking
Several companies offer benchmarking studies to industrial facility managers. These studies provide each facility with a questionnaire to be answered by the facility subsequent to which the benchmarking company produces a report based on the comparison of these questionnaires with similar facilities. Each facility can recognize its own position in the statistics as well as the values for the best-in-class and some other categories. Thus, the facility can see how it compares to similar facilities worldwide. Because this is done in many categories, one can deduce specific improvement areas for each specific facility, and thus benchmarking is said to help each participant in these studies to improve.
While the idea of these benchmarking studies is, as described above, quite sound, these studies suffer from several endemic weaknesses:
- First, no participant knows the identity of the other participants and thus the definition of “similar facility” is entirely in the hands of the organizers.
- Second, as almost no facilities are truly comparable, differences in any one detailed category may be due to causes that are outside of the control of any operator and maintenance organization such as engineering differences in the initial building phase of the facility. Indeed, the benchmarking study only allows conclusions about the nature of differences but not the causes (and thus remedies) for such differences.
- Third, many questions are not as precisely defined as they would need to be for true comparison. For example, the question for the current financial value of the facility could be answered by (a) the known historical building cost, (b) the estimated current re-building cost, (c) the known current book value of the facility, (d) the estimated market value of the facility, and several more possibilities. Clearly, these numbers are quite different and thus lead to different conclusions in the study.
In conclusion, such studies produce results that may indeed lead to favorable changes but they cannot be taken at face value and indeed lack many of the truly interesting facts.
Self-Benchmarking
As an alternative or addition to traditional benchmarking studies, we suggest a method that we shall refer to as self-benchmarking, which simply refers to comparing one's own facility at the current time to itself at previous historical times in order to find developments and differences. We will demonstrate below how this leads to useful results.
It becomes apparent right away that this method solves all of the above weaknesses of the traditional benchmarking studies:
- First, we know exactly who is taking part, i.e. all players in our own facility.
- Second, we are aware how comparable our own facility parts are to each other or how our facility compares to itself at an earlier time.
- Third, as the numbers are centrally collected by one party in the facility there will be no uncertainty as to the meaning and comparability of the numbers.
We note in passing that such a survey is also much faster and cheaper than participating in an external benchmarking study. If the data is set up appropriately within the computerized bookkeeping system of the facility, the study can be largely automated and repeated at monthly intervals to yield a running account of improvements and deficiencies. This is in contrast to external benchmark studies that consume much time and are done at much longer intervals.
We will illustrate the concept of self-benchmarking by using the maintenance department of two sites of a chemical production company in Germany (the sites are located at Moers and Herne). Here, the process includes the following phases:
- Extraction of all maintenance requests (German: Meldung), work orders (German: Auftrag) and the maintenance reports that allow the cost to be divided into human resource costs and material cost and further into internal and external costs.
- Raw processing of this information so that requests, work orders and reports can be matched. The data is cleaned and prepared for further analysis by filling empty entries, deleting exceptional entries and performing a myriad of standard data cleaning and standardization procedures [1].
- Aggregating the information along the following dimensions: by plant within the facility (one plant makes one product), by priority of the maintenance measure, by service types (e.g. repair, inspection, engineering), by request type (e.g. maintenance, shutdown), by planning groups, by divisions, by duration of the maintenance measures, by cost category (e.g. external material cost, internal human resources). In each dimension, we might tabulate the number of measures, the total cost and the average cost.
- Duplicating step 3 for equally sized historical periods so that a time trend is obtained and the facility can be compared to itself at an earlier time (this is optional).
- Interpreting these aggregated data and incorporate them into a report. The interpretation yields natural conclusions and suggestions for improvement, e.g. the relationship between reactive and preventative maintenance. If the raw data is clean enough and the categories are sufficiently detailed, then useful improvements can be directly read off this analysis.
We provide an example of this in figure 1. The vertical axis measures the relative number of work orders for each of the top three priority levels. The horizontal axis denotes the different plants in the facility. The solid gray line is priority 3, the dashed line priority 2 and the dotted line priority 1. The plants have been sorted in decreasing order of priority 3 work order weight. We easily see an inverse relationship between the priorities 1and 2. We also see a tendency of priority 1 increasing as priority 3 decreases. We may definitely see a few plants whose priority 1 weight is far too high compared to the other two priority levels, given the general level. The average weight of priority 1 is 13% but there are plants with weight 50%. The higher the weight of priority 1, the less planning is being done and these work orders will cost more. The plants with a much higher rate of priority 1 measures should be encouraged to changed their practices towards more priority 2 measures, i.e. less fixing of immediate problems by performing more planned maintenance.
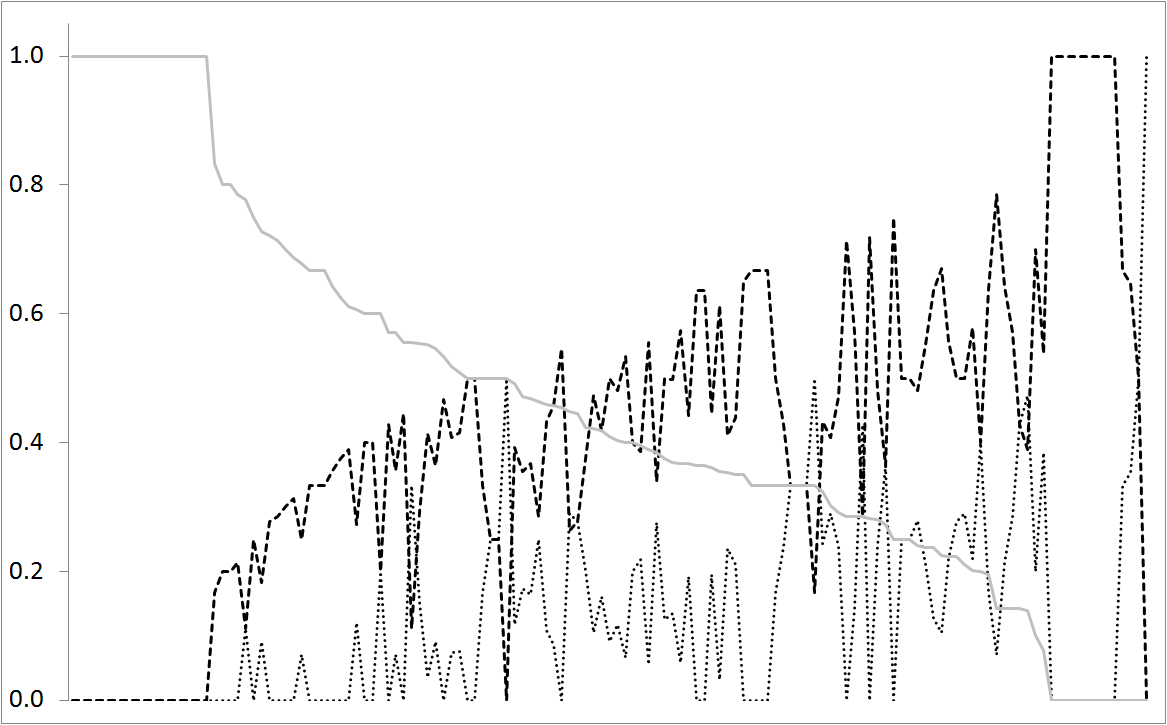
Figure 1: We see the relative number of work orders of any one priority class relative to all work orders of a certain plant. Priority 1 is the dotted line, priority 2 is the dashed line and priority 3 is the gray solid line. The plants have been sorted in decreasing order of the priority 3 work orders.
Results and Conclusions
- Over the course of a year, the maintenance of a site implements many measures that yield a large enough pool of data to allow statistical conclusions to be representative and meaningful. We must be careful to exclude outliers from such conclusions as they skew statistics into the meaningless. What an outlier is must be decided manually but can be pre-processed automatically. A very costly measure is a natural candidate for an outlier but it may not be if this measure is indeed regular.
- After the data is cleaned in such a way, we may compare averages by type with the average overall. In this way, we may discover that a particular equipment of the site is particularly cheap or expensive to maintain. A look into the measures will reveal what went on to yield this effect. Usually there are also particular types of measures that have caused unreasonably large costs. Thus, we can identify the so called bad actors.
- Often, bad actors are those that failed often or those that necessitate particularly expensive measures. In actual fact, the bad actor really is that equipment which causes unexpectedly high total costs. If the costs are to be expected, it is not a bad actor but a normal actor. The costs can be accumulated over either many faults or a few large ones. In total, this is something that must be extracted by an analysis.
- While dividing the measures by priority, we note that the classification of a measure as first priority (to be done as soon as possible) or second priority (to start within three working days) is a significant element in predicting the cost of the measure. The same measure will be 43% more expensive if it is in first priority than in second priority. The reason for this is that the lower priority allows for some planning which reduces the amount of working time and sometimes also material used. (We note at this point also that it is possible to predict a few days in advance when machines fail so that one could immediately transfer many priority-one jobs into priority-two jobs and leverage this cost difference, see [2].)
- From the analysis over types of jobs (i.e. kind of priorities), one can distinguish between preventative and reactive maintenance. The theory goes that more prevention will cause less reaction to be necessary. Clearly, there is an optimum relative amount of prevention versus reaction, both from reliability and expense point of views. This optimum can be discovered by comparing the plant to itself at an earlier time but cannot be discovered in a benchmark study with different plants.
- Something of interest to all facility managers is the question of whether the work is done by internal or external staff and whether material is provided by the stock or ordered in for the job. That is again a point in favor for self-benchmarking. It depends on such features as what the facility generally needs done as well as what the external but geographically local area has to offer in terms of service providers. We again recommend the self benchmarking. Here we can see the evolution over time and find the optimum. If enough work exists, then it is cheaper to do this work with internal staff and if the failure will lead to relatively high production losses, then it is cheaper to have the parts on stock. Also, it makes sense to get external companies in for the larger tasks and to do the smaller ones internally; this also keeps know-how within the company. It is, in general, very helpful to draw a clear boundary between what is large and small but this can only be done relative to the individual plant.
- A principal discovery is that the data of maintenance requests, jobs and reports is often incomplete in that entries may be missing altogether or fields in an entry are empty. Other such items are not correctly filled outwork reports. This is often not discovered in most enterprises because most of the data is not analyzed for internal consistency. Once a self-benchmarking study is undertaken, the data is put into relation to itself and all inconsistencies become apparent. This helps an enterprise by directly improving its data management.
- Throughout the data, there will be anomalies. These are very unusual for some statistical reason. For example, an anomalous task took far too long, cost far too much effort or material and so on. This outlier detection that is intrinsic to data-mining is very helpful to find the items that were either truly unusual (and should therefore be treated specially) or that were incorrectly input into the database.
- Self-benchmarking is a method that compares the present state of a production plant to a past state of the same plant and draws similar conclusions to a normal benchmark study. It concerns itself mainly with the costs and tries to identify potentials for cost savings in the future. We have examined this on the example of maintenance costs in several chemical plants.
We come to several main conclusions: (1) Self-benchmarking is significantly faster and cheaper than normal benchmarking, (2) self-benchmarking yields useful results that allow the plant to reduce costs in the future and find the areas of potential, (3) data management is crucial as a basis for the study and will be improved through the first such study, (4) several useful insights into the operation of the business are possible that will allow relevant changes to be made for the better, (5) this type of study can be automated and be displayed regularly so that the plant is always aware how it is doing.
References
- Pyle, D. (1999): Data Preparation for Data Mining. Morgan Kaufmann.
- Bangert, P.D. (2012): Optimization for Industrial Problems. Springer Verlag.