Turbine Diagnosis in a Power Plant
Dr. Patrick Bangert
algorithmica technologies GmbH
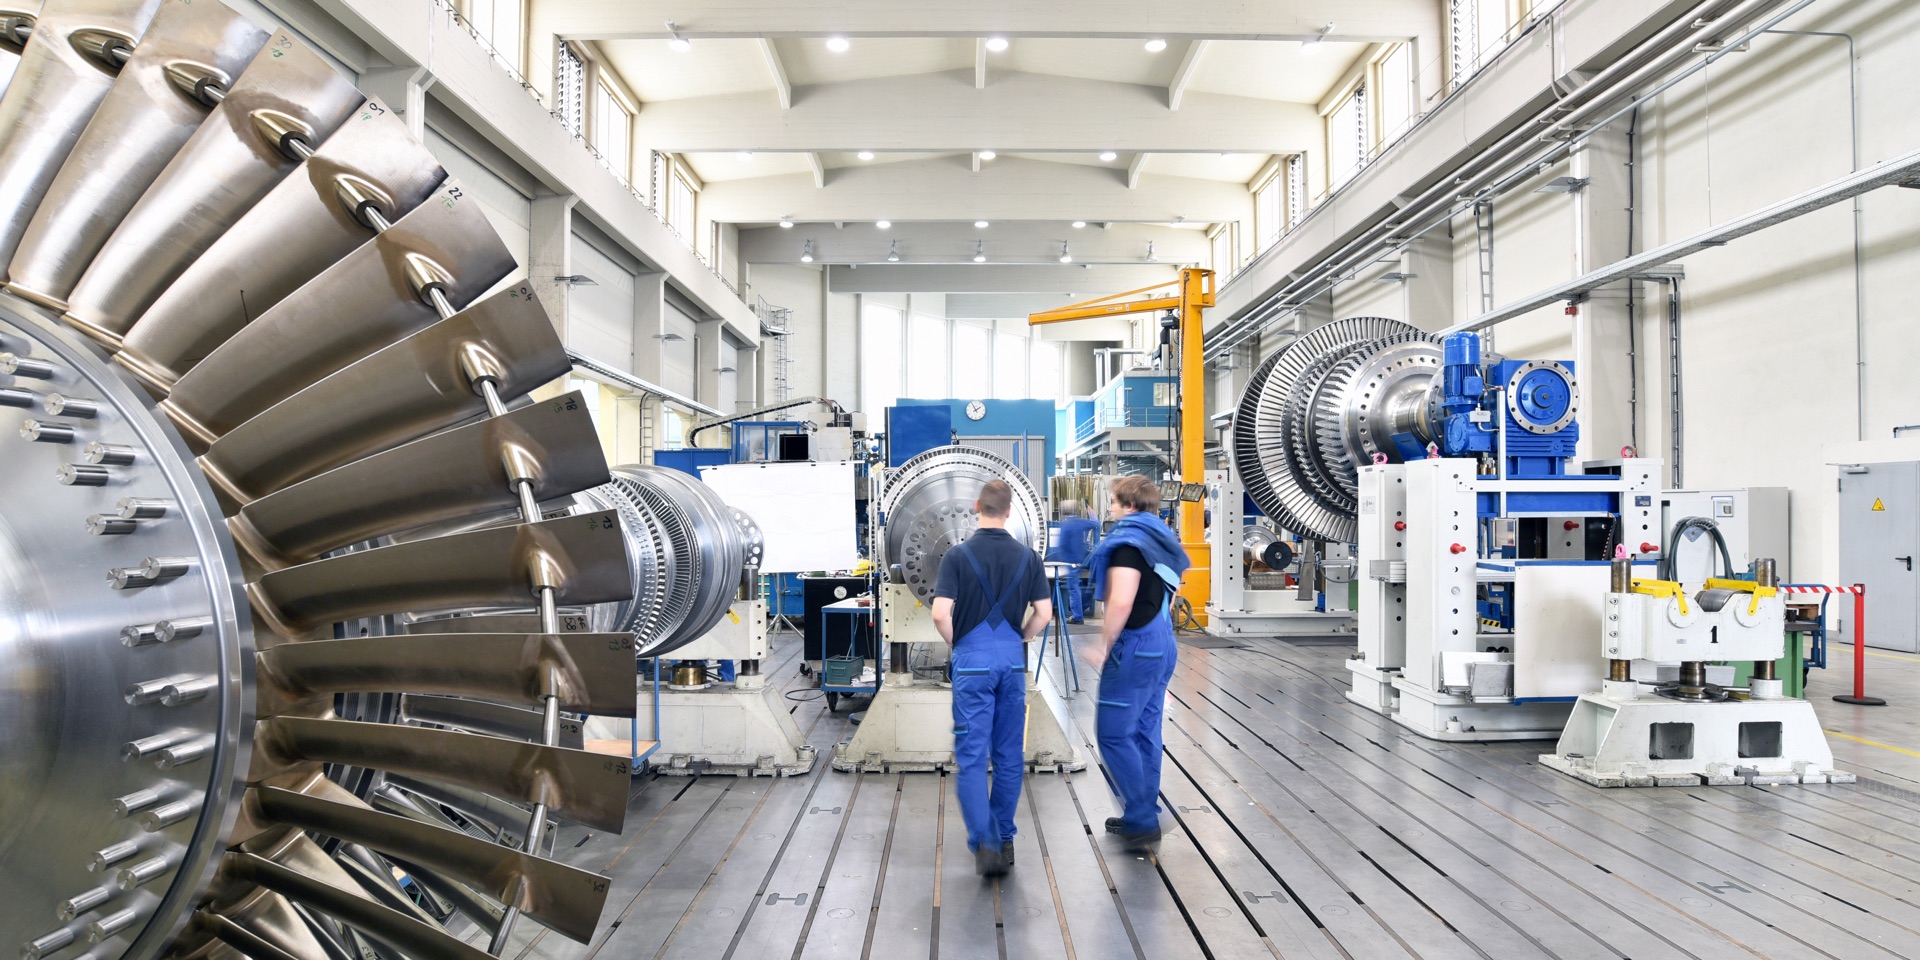
A power plant’s turbine is its most important component. A turbine failure can lead to a long-term shutdown of the entire plant. Thus, it is important to carefully watch the turbine for any signs of abnormal behavior using a variety of sensors installed in key locations on the turbine. The most crucial information regarding the health of the turbine is contained in the vibration measurements. All sensor output is logged into a database and therefore available for study.In order to prevent an expensive shutdown through an unexpected turbine failure, it is expedient to monitor any abnormal behavior that may occur and that could be extracted from the recorded data.
To flag a period of time as “abnormal behavior” we use three independent methods each of which provides an abnormality score. If the score of any method is above a certain limit, then we call that moment “abnormal” according to that method. It is then interesting to see if any particular moment in time is flagged abnormal by no method, just one method, two methods or all three methods. The more methods concur, the more certainty we will have that a real problem exists in that time frame.
For the purposes of this article, we will only give the names of these methods. For further details about them, we refer to the expert literature [1]. The methods are: (1) entropy analysis, (2)singular spectrum analysis (SSA) and (3) Fourier transformation (FT).
In brief, the entropy analysis indicates if we have measured abnormal values, the SSA indicates if there are abnormal variances and the FT indicates if there are abnormal frequencies. These methods concern very different indicators of abnormality and thus may or may not simultaneously detect an event. Depending on which methods signal an abnormality in the same time frame, we may draw conclusions about the nature of that abnormality and direct engineers accordingly. As this interpretation is rather technical, we again refer here to the literature [1]. However, we note in passing that a signaled abnormality does not necessarily indicate a dangerous situation but that dangerous situations are almost always abnormalities in this sense.
In figure 1, we provide a graphical example of the results of one of these methods. The vertical axis denotes the various sensors on the turbine, the horizontal axis is time, and the color of each dot represents the abnormality score – with white meaning normal behavior and black meaning failure or shutdown. We may see that an abnormality starts with certain sensors and proceeds over time to show up on different sensors until it finally disappears. All these abnormality indications have been identified by a human expert as belonging to a single causal chain of events deriving from a single cause.
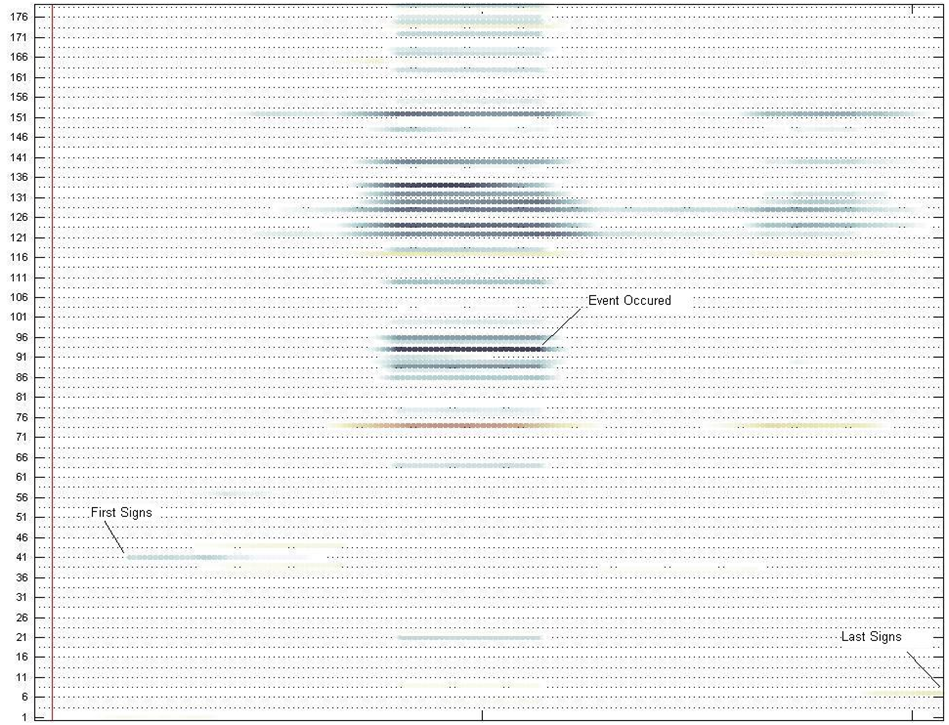
Figure 1: The vertical axis indicates the sensor that is being analyzed so that the image as a whole gives us a holistic health check for the whole turbine. We can read from the plot that the event starts with Sensor 4 , then a more significant deviation is observed for sensors 122 and 151, then more sensors (51) get involved and the largest abnormality is observed for sensor 93. For several days, abnormalities of most sensors disappear and only the sensors 122 and 151 continue deviating and start a second reaction of a smaller magnitude. Finally, all abnormalities disappear.
As discussed above, the combination of methods that detect a particular abnormal event let us interpret what kind of event is taking place and thus aids the engineer in interpreting what should be done about the event. In table 1 below, we summarize, for four turbines, how many events were detected by each combination of methods. Please note that no specific combination of methods is in any sense "better" than another combination of methods, as the combinations indicate events of a different nature.
Table 1: Each combination detects a particular signature of event and thus they should be seen as complementary detection schemes rather than a hierarchy. No one method dominates this table. This shows that events of all signatures do take place in the systems studied.
In figure 2, we provide a plot of the abnormality score for the events detected for one turbine.
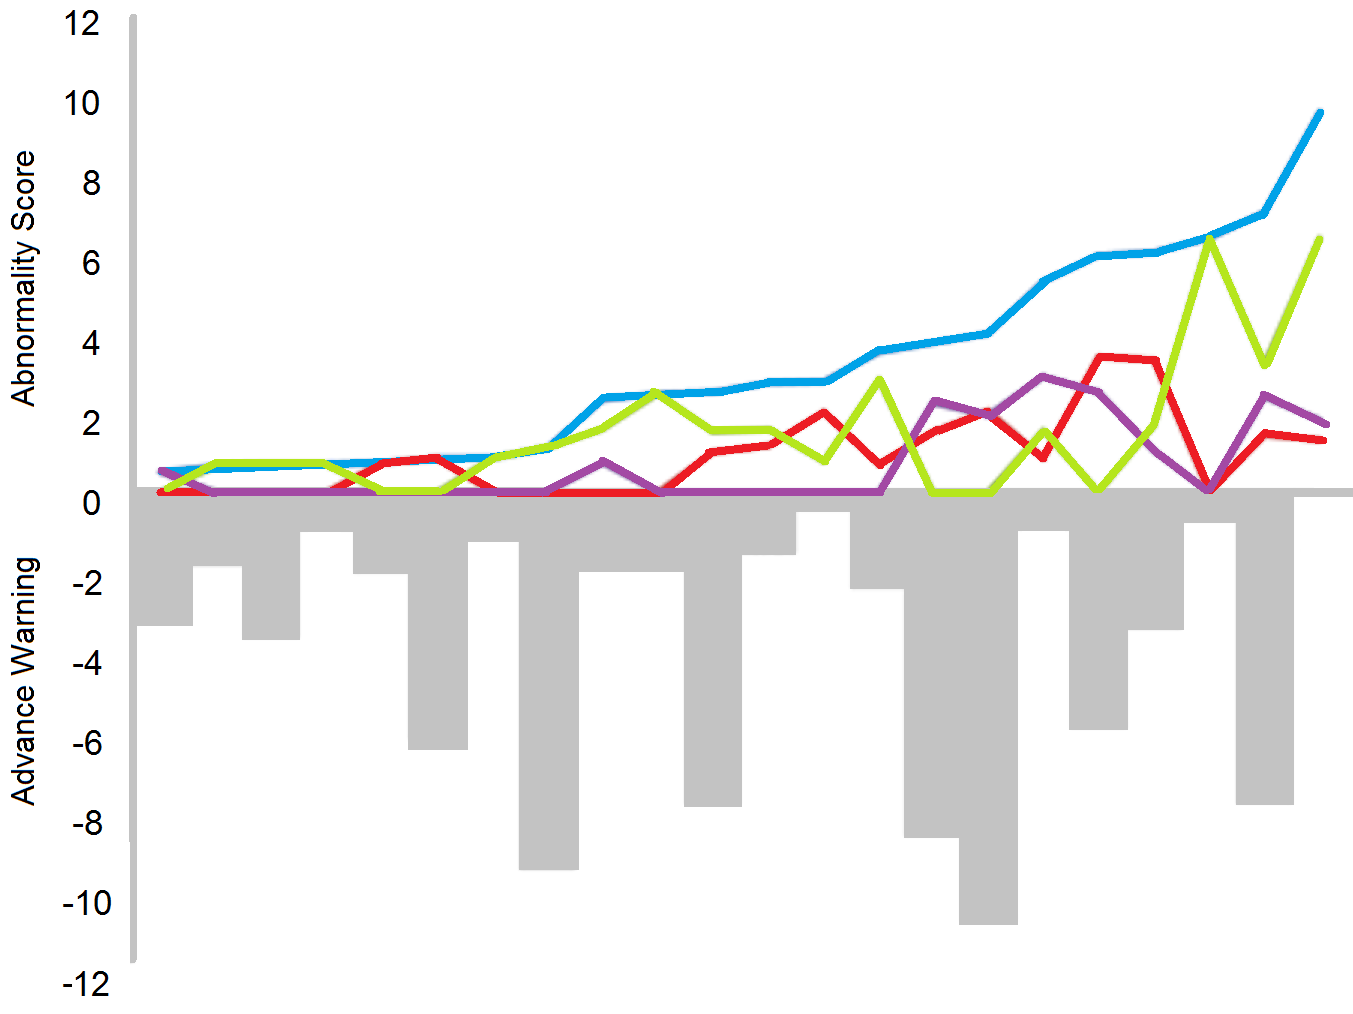
Figure 2: These events are sorted by the sum of their abnormality scores of all three methods. As the score is defined similarly for each method, the numerical value of the score of one method is comparable to the score of another. The sum of all three abnormality scores is plotted in blue whereas the red, green and purple lines indicate the scores of each method. The plot also contains the number of days before an event so that an advance warning would have been possible. The average advance warning time for an event was five days.
The total abnormality score (plotted in blue on figure 2) is approximately exponential. This is an interesting feature as this is not the outcome that would be expected from a large number of random interactions. The observed feature usually results from what is called a “Poisson process”, which is present when events occur continuously and independently at a constant average rate. On this evidence, we conclude that, approximately and on average, the events detected here did not interfere with or cause each other but were independently caused. The (unknown) causation mechanism acts at a constant rate. This means that the system does not exhibit aging over the time period (one year) investigated here. Therefore the underlying problem is not getting worse over time.
We conclude that the methods used here allow the fully automatic screening of measurement data for abnormalities in behavior. All real faults were recognized as abnormalities and most of the events flagged as abnormal were indeed faults that required some form of maintenance to be carried out. The purpose of turbine data analysis is to identify a problem before it leads to damage. As this analysis is usually done manually by experts, it is time-consuming, expensive and error-prone. This procedure therefore saves much human effort in analyzing data and allows that human effort to be concentrated on the really interesting cases.


