Predicting Vibration Crises in Nuclear Power Plants


Roger Chevalier
EDF SA, R&D Division
Dr. Patrick Bangert
algorithmica technologies GmbH
In a nuclear power plant, if the vibration of the turbine axle exceeds a certain limit, we speak of a vibration crisis.It does not represent a real damage but it could, if left unchecked, lead to a major failure. The exact cause of the problem is not precisely identified at present but it always occurs during the same conditions of vacuum pressure and power, two essential measurements on the plant.

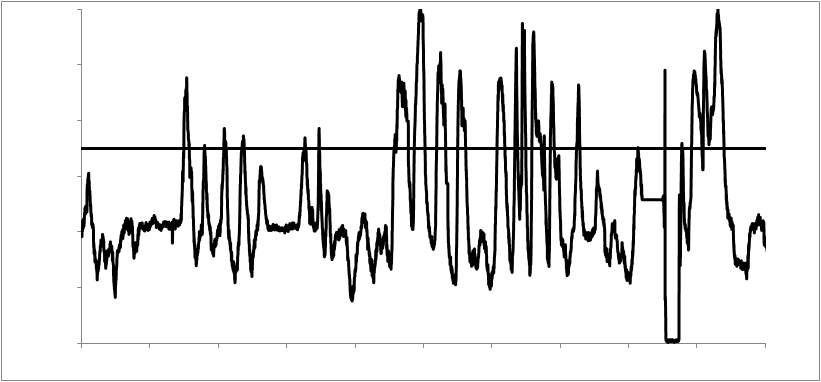
Figure 1: This is the vibration of one bearing over time. The horizontal line is the limit for the vibration crisis, i.e. if the vibration measurement exceeds this limit, we speak of a crisis. It will be our goal to detect such events. The plot represents 35 days.
This study concerns itself with the prediction of future vibration crises and not with determining the mechanism that causes such vibrations. If one could know hours in advance that a crisis will happen, this would help operators to alleviate it: The plant can be regulated into a state more conducive to controlling the impending crisis.
For each of the five bearings that our turbine model has, we have one vibration and two metal pad temperatures. Then we have the steam pressure at several points in the process, the axial position of the turbine shaft, the rotation rate, the active and reactive power produced, and one temperature on the oil circuit. This information is sampled once every ten minutes for five months in order to generate the model and learn the signs of an impending vibration crisis. The dataset contained several examples of such crises so that effective learning was made possible.
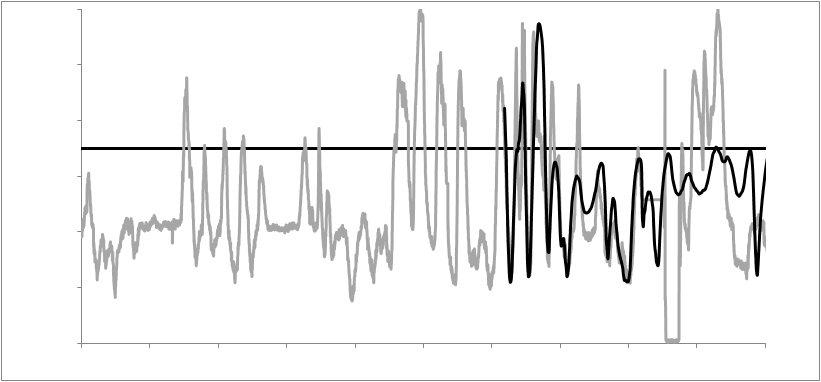
After the model was prepared, it was applied to a new dataset from a different power plant. Figure 1 displays data from this new dataset that was only 35 days in length as opposed to the five months used for training. The first 20 days of data were used to let the model adjust to the fact that the data came from a plant it had not previously seen – demonstrating that the algorithm is capable of adjusting the model to modifications in behavior. Then the model predicted the remaining 15 days, yielding figure 2 in which the known data is in gray and the prediction in black. We observe that the model correctly predicts the next vibration crisis but misses the one after that.
From a variety of examples like this, we have observed that a correct prediction of a vibration crisis can be made up to three days in advance. As the actual physical cause for the crisis is unknown, we do not know where this limit of three days comes from but the cause-effect mechanism is apparently not visible sooner than that.

Figure 2: The measurement data from figure 1 is in gray. The line in black is the prediction after the initial model adjustment. The first vibration crisis is predicted correctly while the second is missed.
We have made 6 such predictions in a double blind study and have correctly predicted 5 vibration crises from among the 6 cases. The model is thus quite successful in being able to predict the future occurrence of a crisis. This is the case even though the specific causal mechanism remains under investigation. The model could be improved if the problem would be better understood so that the data can be more properly prepared.