Failures of Wind Power Plants

Dr. Patrick Bangert
algorithmica technologies GmbH
Wind power plants sometimes shut down due to diverse failure mechanisms and must therefore be maintained. These maintenance activities are costly due to logistics and delay–especially in the offshore sector, but also in the countryside. Common failures are, for example, due to insufficient lubrication or bearing damages. These can be seen in vibration patterns if the signal is analyzed appropriately.
It is possible to model dynamic evolving mechanisms of aging in a mathematical form so that a reliable prediction of a future failure can be computed. For example, we can say that a bearing will fail within 59 hours from now because the vibration will then exceed the allowed limits. This information allows a maintenance activity to be planned in advance and thus saves collateral damage and a longer outage.
Wind power plants experience failures that lead to financial losses due to a variety of causes. Please see figure 1 for an overview of the causes, figure 2 for their effects and figure 3 for the implemented maintenance measures. Figure 4 shows the mean time between failures, figure 5 the failure rate per age group and figure 6 the shutdown duration and failure frequency. All statistics used in figures 1 to 6 were obtained from ISET and IWET.
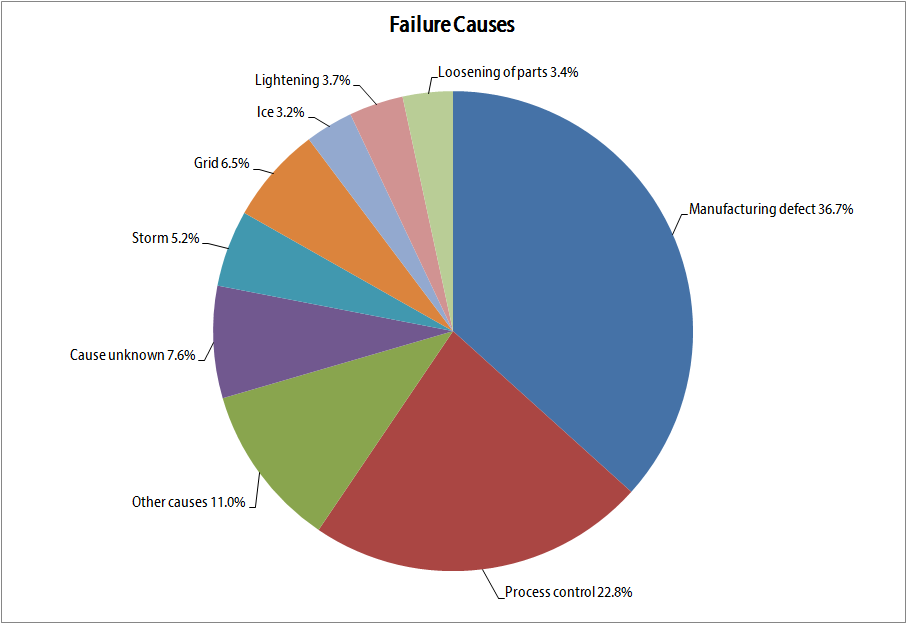
Figure 1: The causes for a wind power plant to fail are illustrated here with their corresponding likelihood of happening relative to each other.
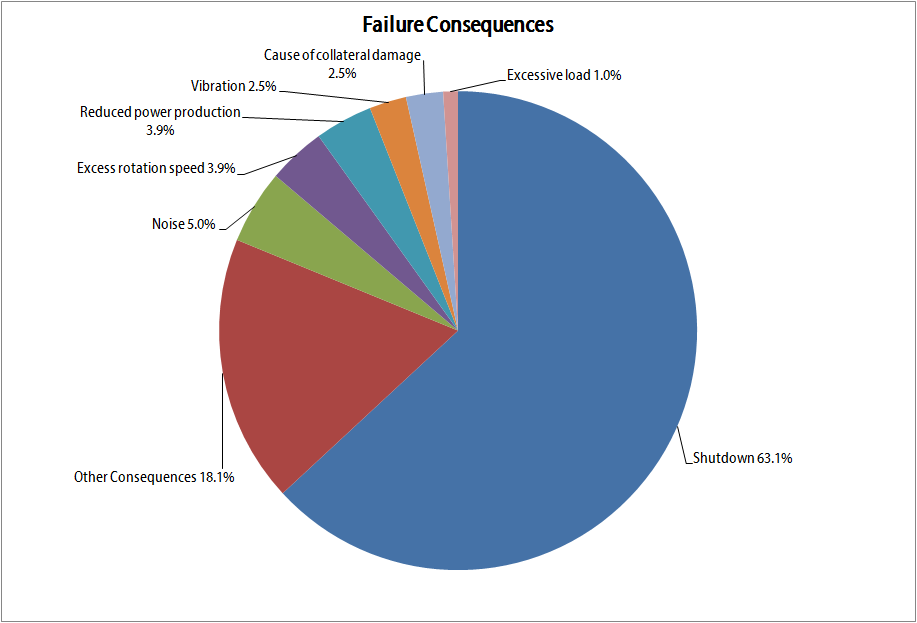
Figure 2: The effects/consequences of the causes of figure 1 are presented here with the likelihood of happening relative to each other.
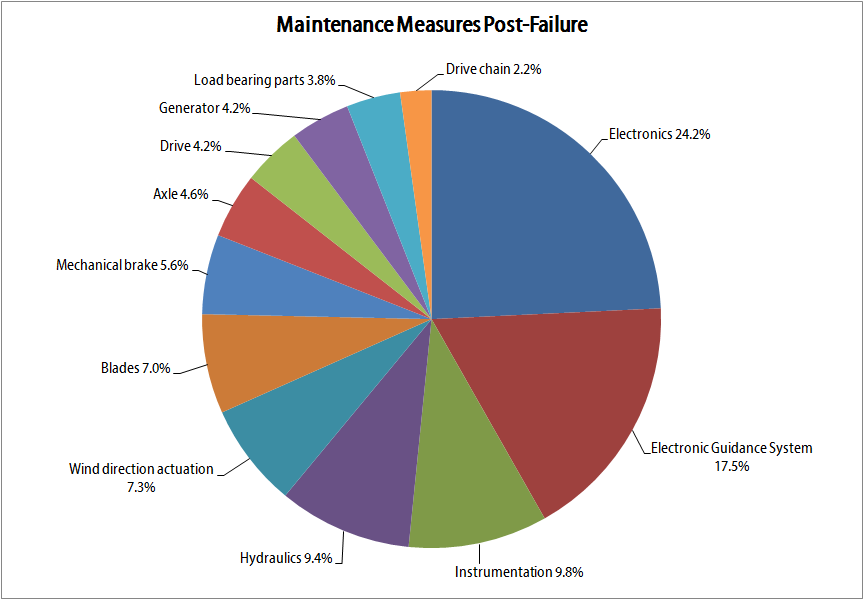
Figure 3: The maintenance measures put into place to remedy the effects of figure 2, with the likelihood of being implemented relative to each other.
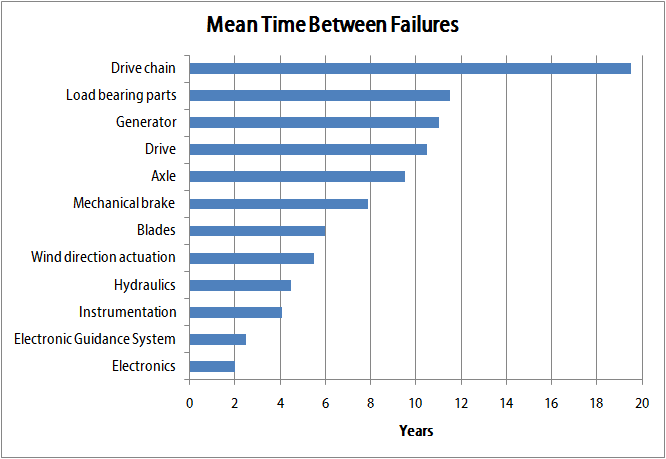
Figure 4: The mean time between failures per major failure mode.
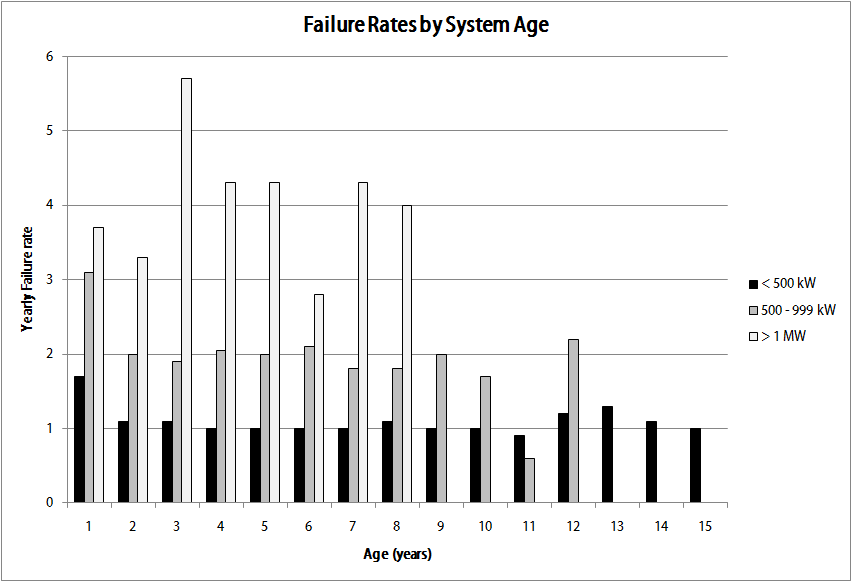
Figure 5: The yearly failure rate as a function of wind power plant age. It can be seen that plants with higher output fail more often and that age does not significantly influence the failure rate.
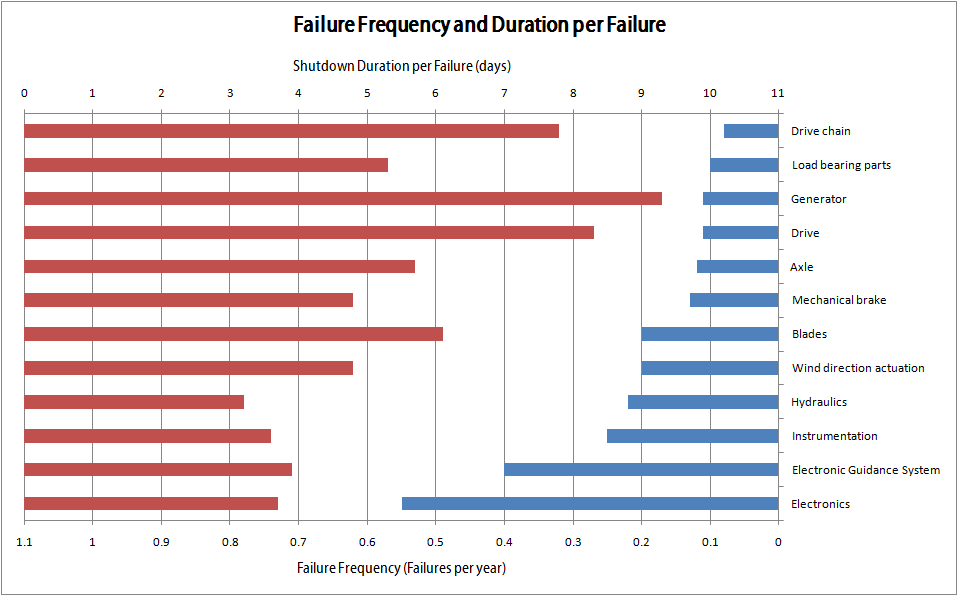
Figure 6: The failure frequency per failure mode (blue) and the corresponding duration of the shutdown in days (red).
From these statistics we may conclude the following:
From this evidence, we must conclude that internal causes are responsible for a 1% capacity loss for plants with less than 500 kW, 2% for plants between 500 and 999 kW and 3.5% for plants with more than 1 MW of power output.
In a wind power field like Alpha Ventus in the North Sea, with 60 MW installed and expecting 220 GWh (i.e. an expectation that the field will operate 41.8% of the time) of electricity production per year, the 3.5% loss indicates a loss of 7.7 GWh. At the rate of German government regulation of 7.6 Eurocents per kWh, this loss is worth 0.6 million Euro per year. Every cause leads to some damage that usually leads to collateral damages as well. Adding the cost of the maintenance measures related to these collateral damages themselves yields a financial damage of well over 1 million Euro per year. The actual original cause exists and cannot be prevented – but if it could be identified in advance, then these costs could be saved.
This calculation does not take into account worst case scenarios such as the plant burning up and thus effectively requiring a new build.
In order to demonstrate the feasibility of predicting a failure before it happens using mathematical modeling, a typical wind power plant (not in Alpha Ventus) was chosen as a case study. All physical measurements available on that plant were recorded to a data archive for six months. One value per second was taken and recorded if it differed significantly from the previously recorded value. There were a total of 56 measurements available from around the turbine and generator but also subsidiary systems such a lubrication pump and so on. Using five months of these time-series, a mathematical model was created and found that the model agreed with the last month of experimental data to within 0.1%. Thus, we can safely assume that the model correctly represents the dynamics of the wind power plant.
This system was then allowed to make predictions for the future state of the plant. The prediction, according to the model's own calculations, was accurate up to one week in advance. Naturally, such predictions assume that the conditions present do not change significantly during this projection. If they do, then a new prediction is immediately made. If for example a storm suddenly arises, the prediction must be adjusted.
One prediction made is shown in figure 7 where we can see that a particular vibration (the blue curve) on the turbine will exceed the maximum allowed alarm limit after 59 ± 5 hours from the present moment (present moment: the purple vertical line towards the right). Please note that this prediction actually means that the failure event will take place somewhere in the time range from 54 to 64 hours from now. A narrower range will become available as the event comes closer in time. This information is however accurate enough to become actionable. We may schedule a maintenance activity in two days from now that will definitely prevent the problem. Planning for two days in advance is sufficiently practical in order to solve the problem in practice.
In this case, no maintenance activity was performed, in order to test the accuracy of the prediction. It turned out that the turbine actually failed after 62 hours from the moment it was predicted to fail due to this particular vibration exceeding the allowed limit. This failure led to contact between the drive shaft and the casing, which led to a fire effectively destroying the plant. The remainder of the plant had to be demolished and replaced.
If, on the basis of the model’s prediction, one would have intervened and remedied the cause of the excessive vibration, the failure of the plant could have effectively been prevented – with a minimum amount of time outage and financial damage: Just a few inexpensive parts would have had to be replaced with minimum human effort preventing the actually experienced total loss.
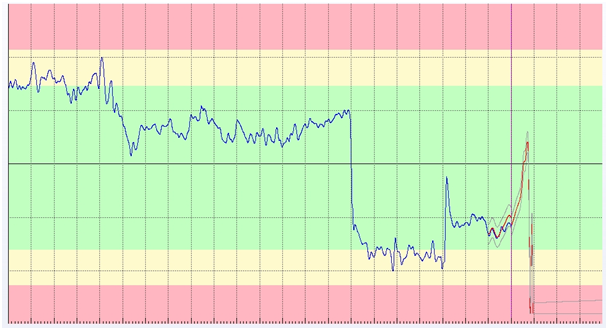
Figure 7: The prediction for one of the wind power plant's vibration sensors on the turbine clearly indicates a failure due to excessive vibration. The vertical line on the last fifth of the image is the current moment. The curve to the left of this line shows the actual measurements, the curve to the right shows the model's output with the confidence of the model; i.e. it shows the future failure that then actually happened.
It would have been impossible to predict this particular event more than 59 hours ahead of time as the qualitative change in the system (the failure mode) occurred just a few days before the event. The model must be able to see some qualitative change for some period of time before it is capable of extrapolating a failure and so the model has a reaction time. Events that are caused quickly are thus predicted relatively close to the deadline. In general, failure modes that are slower can be predicted longer in advance.


